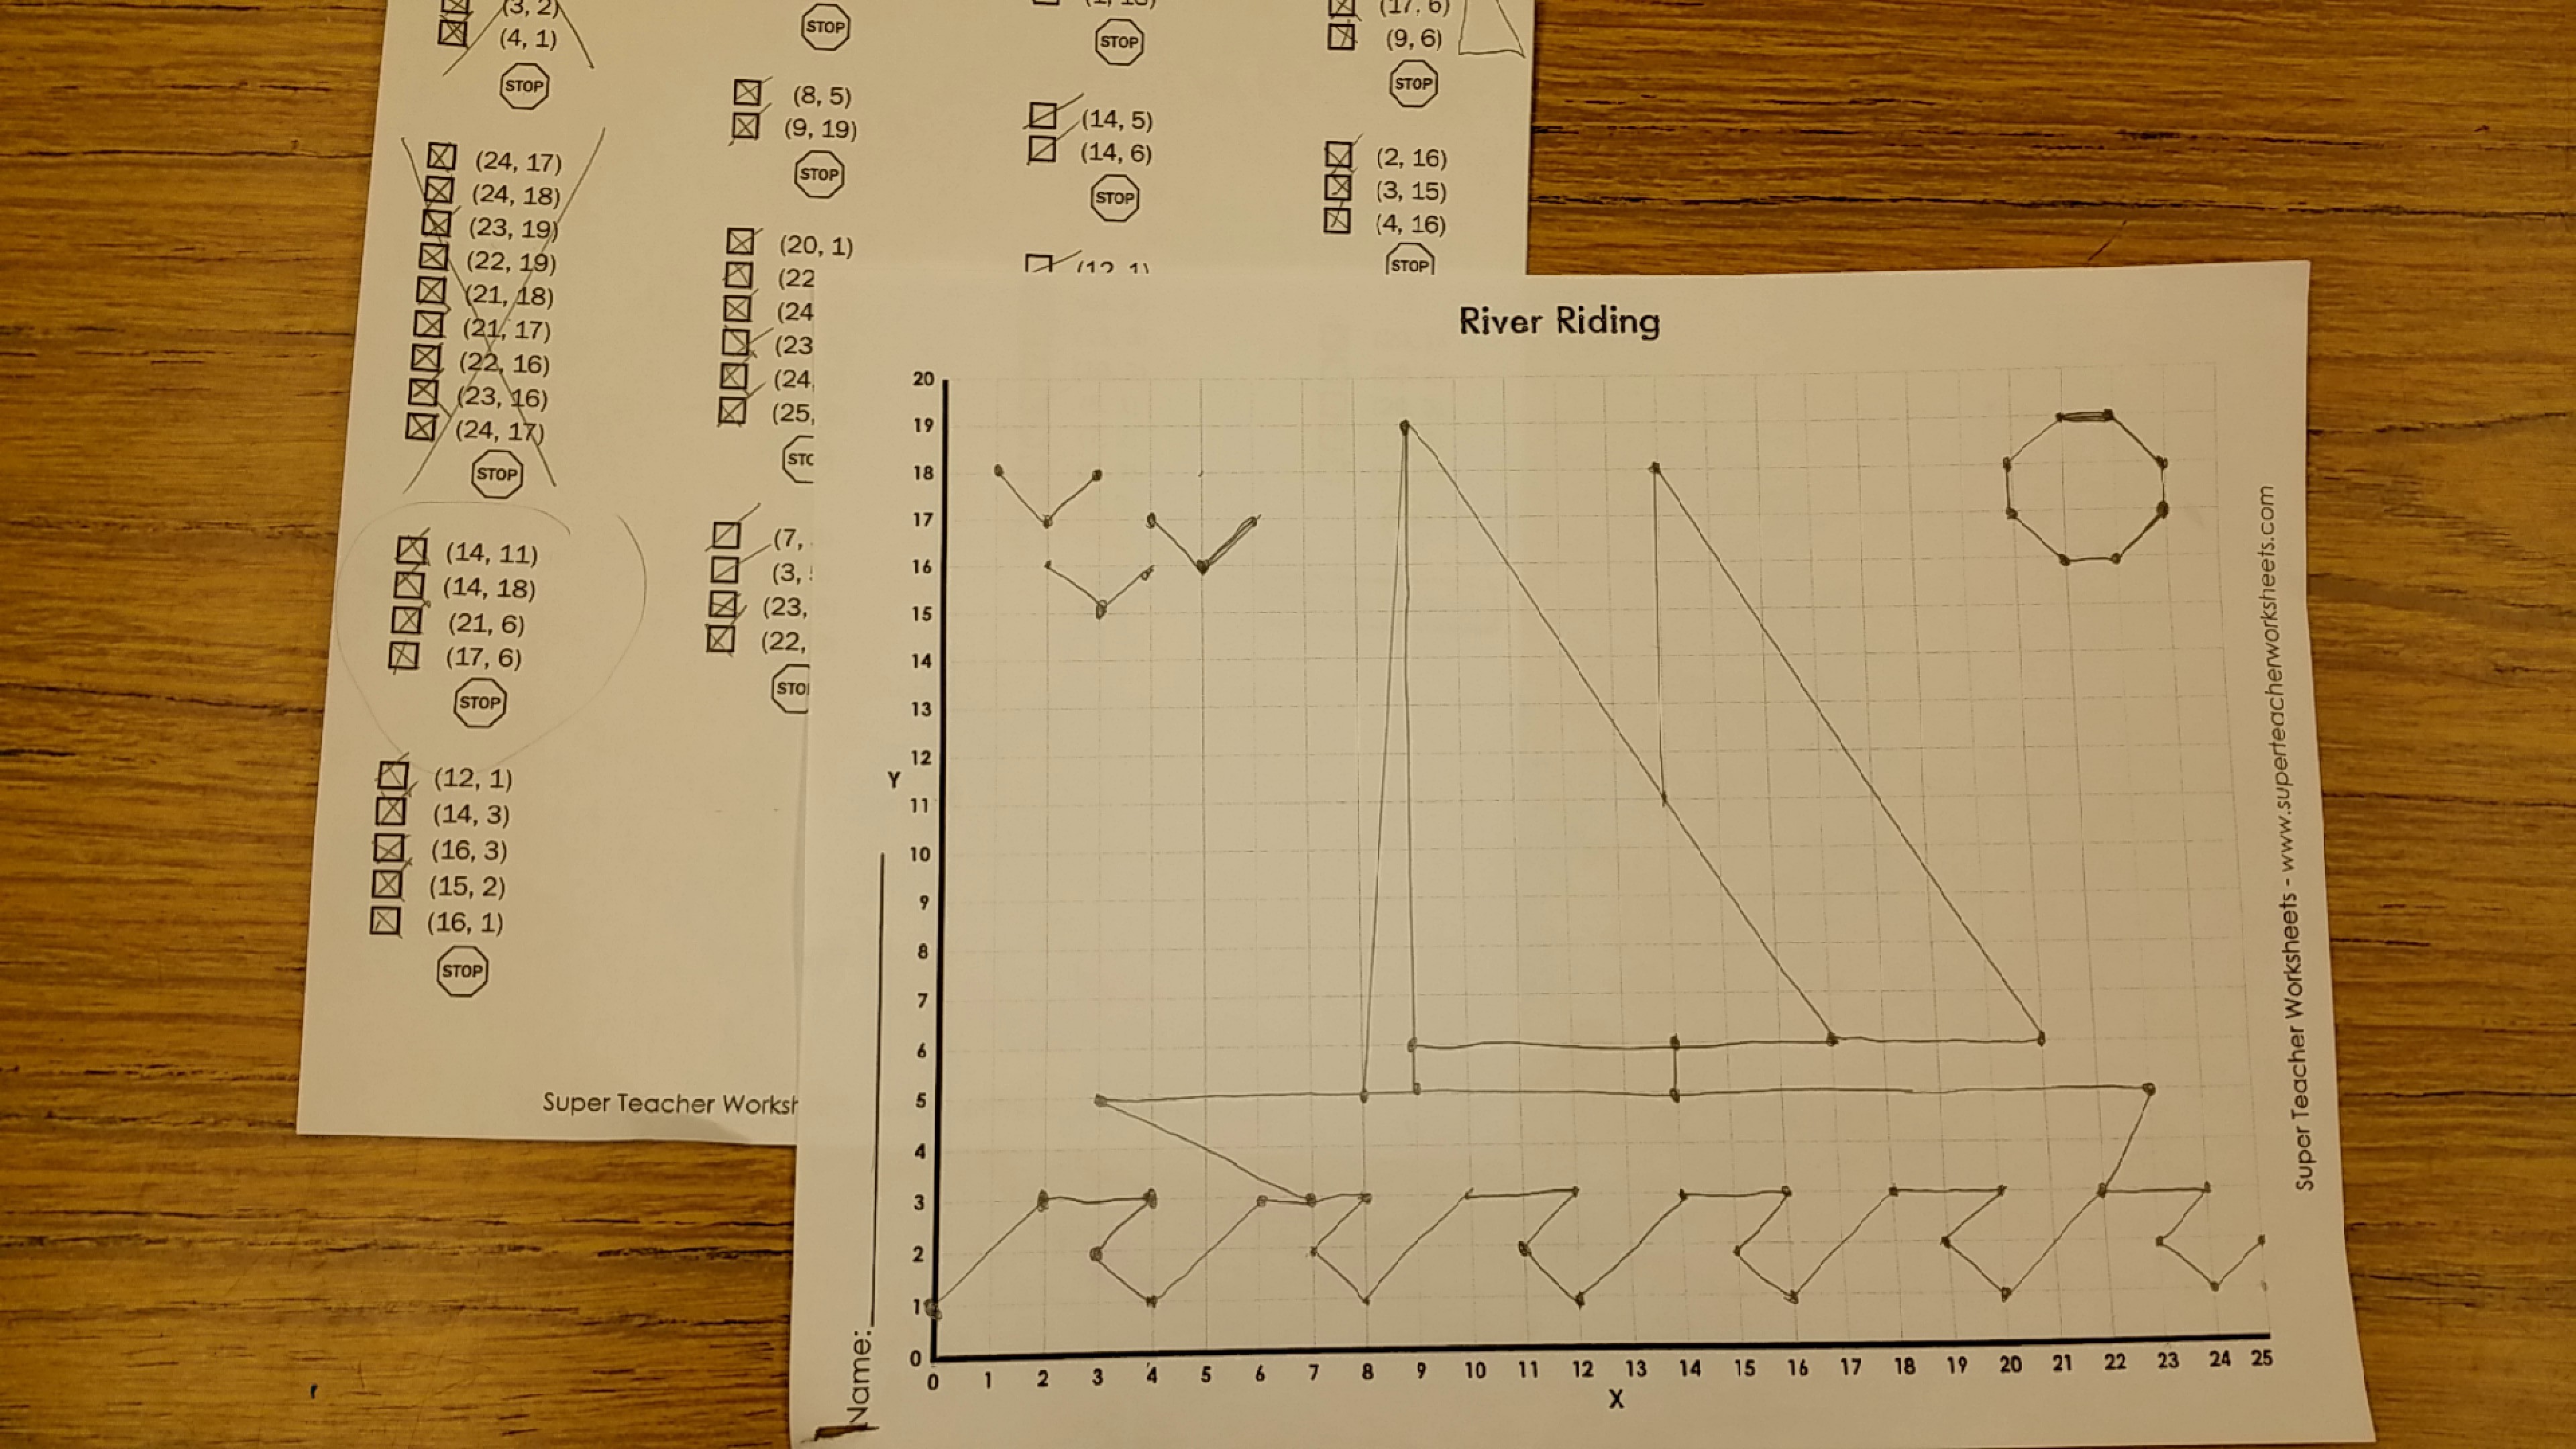
On November 2nd, 4th and 5th graders were given the job of finding locations of earthquakes and volcanoes on a map by using coordinates. They struggled with understanding the process behind this, so this week we took a step backwards to practice how to find coordinates on a grid. After graphing the points on the grid and connecting them, it made a picture. Many students asked “why are we doing math in science?” to which I replied that the two were linked and that scientists often need to keep data, and that data often needed to be figured out by using math. They HAVE done math before in the science lab, so this really is not anything new, but this time the lesson was specifically math in order for them to be able to continue with our earthquake and volcano mapping. Here is the picture that we made using coordinates: