Analyzing Data from Google Earth

1. Enable KML in Google Earth

For the last couple weeks we have been looking at volcanoes using maps or Google Earth. Since we have not had time to actually view all of the volcanoes at once, I will make it easier for you. 

  1. Open Google Earth web version.
  2. Go into Google Earth’s settings and “enable KML import” – toggle the button to blue. (click the three bars at the top left and then “settings,” then scroll to the bottom)  Short video shows how to do this.

2. Import Volcano KML

  1. Return to this page and download this file. The file will be in your folder.
  2. Go back to Google Earth and into “Bookmarks.”
  3. You will see “Import KML File” at the top. Click on this, then “from file” (not Google Drive).
  4. It will open the file explorer window. Go into your download folder and select “google-earth-volcanoes.kmz.”
  5. It will automatically load all of the volcanoes. 

3. Explore from a Distance

Now that you have all of the volcanoes loaded into Google Earth, take a look at the volcanoes from a distance – don’t zoom in too close. Move Earth around so that you can see all of them. What do you notice? What do you wonder?

Question: Why do volcanoes occur in these locations?

Use a claim-evidence-reasoning statement to explain your thinking. Here is an example, but also see the hints below.

Sentence frame: Volcanoes _______ [claim]. This is because ________[evidence]. This might be because ________ [reasoning].

Claim

A claim directly answers the question.

Use key words provided by the question or prompt as you write your answer.

Avoid using phrases like “I think” or “I believe.” Be CONFIDENT in your claim!

  • Volcanoes occur ___________.
  • ___________ happened when _________ 
  • I observed ________ when _________. 
  • I compared ________ and __________. 
  • I noticed __________, when _________. 
  • The effect of __________ on ___________ is _________

Evidence

Provide reliable data, clues, or information to support your claim.

What is your proof?

What do you observe that proves your claim?

  • In the image/map/Google Earth ____
  • One piece of evidence includes ___
  • In the data _____ 
  • The evidence I use to support ______ is _____ 
  • I believe _____ because _______. 
  • I know that ____ is _____ because ______ 
  • Based on _____, I think _______. 
  • Based upon ______, my hypothesis is ______.

Reasoning

Explain in detail how your evidence supports your claim.

Restate your claim and evidence to show your conclusion – your reasons for your thinking.

  • Based on this evidence, volcanoes _____
  • The reason I believe ______ is _________.
  • All of this proves that _____ because ______.
  • Based on the evidence, we can conclude
    _____ because ______.
  • From this evidence, the conclusion we can
    make is ____because _____.
  • These facts work together to build a case
    that _____ because ______.

4. Adding in Earthquakes

Now we are going to add Earthquakes to Google Earth. We can do this the same way that we added the volcanoes from above. 

  1. First you need the USGS kml file. You can download it here
  2. Upload it the same way you did the volcano list – “Import KML File” and then “Open File.”
  3. Find the file in your download folder – it is called 2.5_month_age_animated_link.kml.
  4. What claim-evidence-reasoning statement can you make from observing the Earthquake data? How does it connect to volcanoes? Earthquakes and volcanoes _________ [claim]. This is because _______ [evidence]. This occurs because __________ [reasoning].
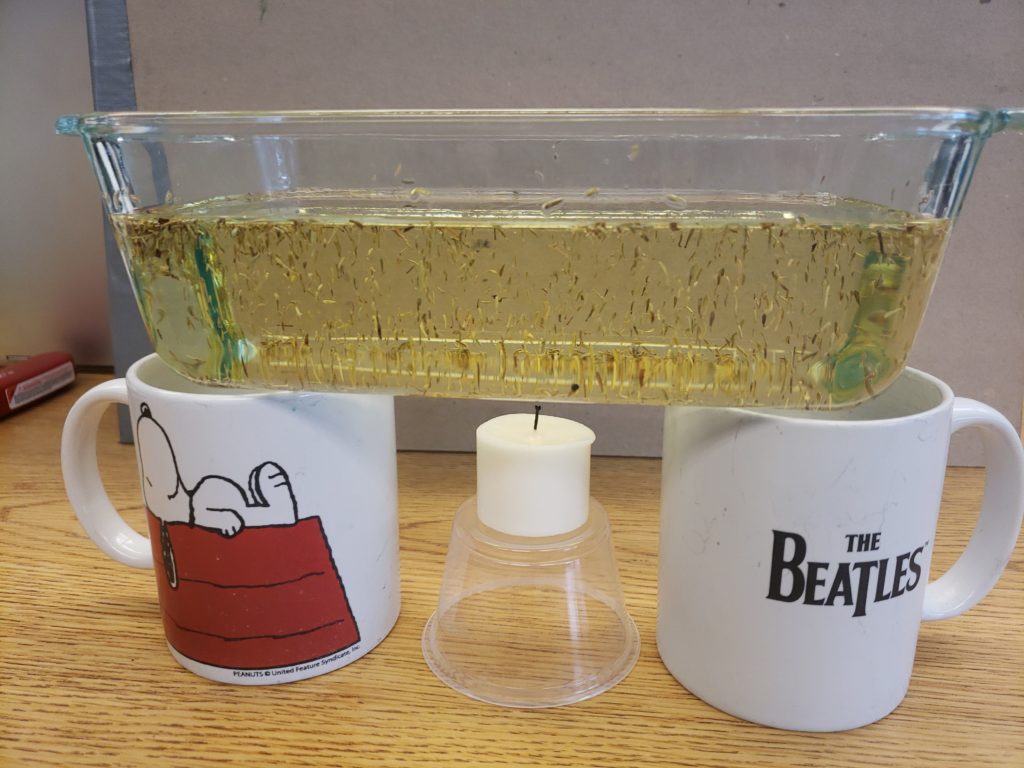
5. Oil Observation

Last week we made an observation of oil and thyme over a heat source. Your assignment was to draw a model before and after the candle was lit.

  1. What pattern did you observe?
  2. How is this connected to volcanoes and/or earthquakes?

Penguins Symbaloo

For the Epic block, the code is: iqy0462

The Mantle and Crust

Previous Lesson

Last week we worked on mapping out volcanoes. I know that Google Earth did not work for most students, so, today, we will revisit that. You can return to that post here

Part 1

By now you should have created a model of Earth’s layers in your science notebook. 

The layers should be labeled.

Just want to check that we have completed this in our science notebook.

earth-clip-layer-3

Part 2 - Making a Model

A model is an explanation of what we observe, discover, and learn – usually through drawing. 

Draw a model of the set up we have on the table. 

We will uses this procedural vocabulary:

  • Container
  • Heat source
  • Supports
  • Oil
  • Thyme


We are going to observe the contents of the container without heat first. Then we will add heat and make a second observation. 

You will make a model in your science notebook to show what is happening in the demonstration. 

Remember a model shows the visible AND the invisible.

  1. What do you notice? 
  2. What are you wondering?
  3. How is this related to our Earth layers model?

Cloud Types with Cotton

Look at these cloud photos.

Questions for you to think about:

  1. How are they the same?
  2. How are they different?
  3. WHY are they different?
  4. What makes the clouds change?

Stratus Clouds

How would you describe stratus clouds?

What words would you use?

Cumulus Clouds

How would you describe cumulus clouds?

What words would you use?

Cirrus Clouds

How would you describe cirrus clouds?

What words would you use?

Cumulonimbus Clouds

How would you describe cumulonimbus  clouds?

What words would you use?

Different Cloud Types

There are actually a lot more types of clouds!

But there names combine the ones we heard above.

Stratus = low or layered

Cumulus = puffy, heap, or pile

Cirrus = high, curl, or fringe

Nimbus = storm or rain

How to Make Clouds from Cotton

  1. Fold the paper in half
  2. Fold the paper in half again
  3. Open up the paper
  4. In the first box, write your name
  5. Write the cloud words in each of the other three boxes. 
  6. Stretch the cotton balls to make the shapes of the clouds.
  7. Use white glue to glue them on.

Stratus are low clouds and cover the sky.

Cumulus clouds are puffy

Cirrus clouds are high, thin, and stretched.

We are going to read this book. 

Remember the questions that we have above. 

  1. How are they the same?
  2. How are they different?
  3. WHY are they different?
  4. What makes the clouds change?


Plotting in Google Earth

1. Earth's Layers

Last week we made a clay model of Earth’s layers. In your science notebook, draw a model on one page to represent the layers we learned about last week -BUT we are going to split the mantle into two – lower mantle and upper mantle. See the graphic below.

  • Inner Core
  • Outer Core
  • Lower Mantle
  • Upper Mantle
  • Crust

We will add more to this model later.

2. Loading Volcanoes in Google Earth

Before we work in Google Earth, we need to change a setting. You need to be logged in to your Google account in order to use Google Earth and save your bookmarks.

Watch this tutorial on how to do the set up and to also add bookmark locations. 

You will need Google Earth and the Volcano List.

Text instructions are below.

If you don’t want to follow the video directions. Here are the directions to read.

  1. Open Google Earth
  2. Go into the 3 bars and check that you are logged in.
  3. Scroll down to settings and click.
  4. In the settings window, scroll all the way down to the bottom. 
  5. Turn on the KML – “Enable KML file import” – the button should be blue.

  1. Keep Google Earth open.
  2. Open the Volcano List. This will open in a new tab.
  3. Copy the name of one of the volcanoes by highlighting the name and clicking on control C (or right click and copy).
  4. Click on the tab for Google Earth. 
  5. Find the search/magnifying glass.
  6. Paste the volcano name into the search field by using control V (or right click and paste).
  7. Click the magnifying glass or hit return.
  8. The map will fly in to that location.
  9. A picture will pop up that will have the bookmark symbol in the bottom left corner. Click that to save the location.
  10. Go back to the volcano list and copy another name, and repeat.
  11. Finish entering all the volcanoes – there are quite a few!!

Questions for Your Science Notebook

After you have added all of the volcanoes, answer these questions in your science notebook.

  1. When you look at the volcano locations, do you see any patterns? Describe the pattern.
  2. If a new volcano were to form suddenly on Earth, what type of location would you expect it to pop up?
  3. What do you think causes this pattern?

3. Adding Earthquakes using a KML File


Next we are going to enter earthquakes into our Google Earth map. This time, I will give you a short cut, and you won’t have to enter them separately. 

Follow the instructions in the video to add the KML file. You need to download it by clicking the link.

If you did not get your volcanoes all loaded, here is a short cut. Click here to download the volcano KML file

Text instructions are below.

If you don’t want to follow the video directions. Here are the directions to read.

  1. Click here to download the KML file
  2. Open Google Earth
  3. Go into the bookmarks from the side menu in Google Earth. 
  4. Click on “Import KML File.” This will be above the bookmarks. If you see the word “Done” instead, click on that first, then the import option will show up.
  5. Click on upload file.
  6. Find the 2.5_month_age_animated_link.kml file in your downloads folder.
  7. Click on the file, then open.

Questions for Your Science Notebook

After you have added all of the earthquakes, answer these questions in your science notebook.

  1. What patterns do you see with the locations of most earthquakes?
  2. How does this pattern compare with the pattern of volcanoes?
  3. What do you think is causing these patterns to occur?

Kinder and 1st Grade – Weather and Clothing

Your friend is coming to visit. What should they pack in their suitcase?

Your friend is coming to visit. They live in another place and they want to know what the weather is like. 

What should they pack in their suitcase so they are ready for San Diego winter weather?

What is it like in San Diego during the winter? 

How does our weather compare to a place like Alaska during the winter? 

The pictures on the left show winter in San Diego. 

What should your friend pack? 

See below.

These are the clothes you have on your paper. 

What should your friend pack?

What should they leave at home?

Are there any clothes that are maybes?

Your friend lives in a place called Fairbanks, Alaska. 

This is what their winters look like.  

What clothes would they need there? 

If you were going to visit your friend in Alaska, what would YOU need? 

How are the two places different?  

How are the clothes you wear different?


What to pack for San Diego in the winter?

YES - Pack these

No - Leave these at home

Cut out and glue clothes to bring to San Diego here in your notebook. 

Cut out and glue clothes to leave at home here in your notebook. 

2nd Grade Weather Lesson

Today we are going to explore weather and weather charting. We will first fill in a KWL chart together as a class. A KWL chart helps us to check our understanding along the way. The K stands for KNOW – what we THINK we know. Sometimes we think we know something, but we find out that we were not correct. The W stands for what we WANT to know. This is the place for our questions or wonderings. The L stands for LEARN. This section will be filled in as we have learned something. To begin with, we will fill in the K and the W as a class. Last week, you did this in your science notebook. You can use your science notebook to help make the class chart. 

KWL Chart

K – What We Think We Know W – What We Want to Know L – What We Learned
   

Weather Underground

Click to visit the Weather Underground site for a weather calendar for January. You can also take a look at other months and other locations to see what the weather is like in different areas around the world.

Take a look at the calendar and share the things that you notice about it. What does it include? What do you have questions about?

January Weather Calendar

We will use this calendar to record the data that we have so far for January. First, we need to make sure we understand the symbols.

What is the difference between Partly Cloudy, Mostly Cloudy, and Cloudy?

They are all cloudy – so how do you know the difference?

To draw the symbols, use:

  • partly cloudy = 1 cloud and the sun
  • mostly cloudy = 2 clouds and a sun
  • cloudy = 1 cloud

Below is what the Weather Underground January calendar shows as of Monday, January 14th. Does it match with what the weather actually was at the beginning of the week? Did we get rain on Monday and Tuesday? Is it raining today? What do you think about the rest of the month? Why are January 28th-January 31st blank? (I copied this on Monday, January 14th at 6:00am)

Ever notice how all of the winter photos we see show snow? 

Is that true here in San Diego? What has been your experience with snow? 

What is typical winter weather in San Diego? 

Why do we not get snow?

What kind of clothes would you need for a typical San Diego winter?


?